Sunday, May 17, 2015

Unit 7 Notes

A BOP "Chart" (4/9/15)


Notes (4/13/15)

BOP: Balance of Payments

Official Reserves: 
  • Foreign currency holding of U.S Federal Reserve System
  • When there is a balance of payments surplus the Fed accumulates foreign currency and debits the balance of payments 
  • When there is a balance of payments deficit the Fed depletes its reserves of foreign currency and credits balance of payments 
  • Official Reserve 0 out the BOP
Active v. Passive Official Reserve:
  • U.S is passive in its use of official reserves. It does to see to manipulate dollar exchange rate 
  • People's Republic of Change is active in its use of official reserves. It actively buys and sells dollars in order to maintain a steady exchange rate with U.S

Notes (4/14/15)

Trade Deficit: 
  • Imports > Exports
Trade Surplus:
  • Exports > Imports 
Good Exports + Good Imports

Current Account: 
  • Balance of trade + net investments + net transfers 
Capital Account:
  • Foreign purchases of U.S assets + U.S purchases of assets abroad 
Official Reserve: 
  • current account + capital account
Calculate Goods & Services:
  • Good imports + service imports 

Notes (4/27/15)

Purchasing Parody:
  • When currency rates are set by international markets, changes would be based on actual currency power of currencies 
  • Ex.) If U.S $ to Europe is $1.50 to 1 then each $1.50 will buy 1 Euro. However, if item in U.S cost $1.50 and then cost more/less 1 Euro, the parody is lost. Markets will adjust quickly in floating rates or pressure for 0 will occur in fixed rates 
Why do we exchange currencies?
  1. To invest in other countries; stocks and bonds 
  2. Sell exports and buy imports 
  3. To build factories or stores in other markets 
  4. Hold currencies in bank currencies for further imports, exports, or business loans 
  5. Speculate on currency values 
  6. Control excessive imbalance; balance will come from BOP 

Absolute Advantage v. Comparative Advantage (4/29/15)

Absolute Adv.:
  • Individual: exists when a person can produce more of certain goods/services then someone else in same amount of time 
  • National: exists when a country can produce more of a good/service then another country can in the same amount of time 
  • Faster, more efficient
Comparative Adv.:
  • Individual/National: exists when an individual/nation can produce a good/service and lower opportunity cost then another individual/nation
  • Low opportunity cost
Input Problems:
  • The country/individual that uses the least amount of resources, land, or time has the absolute advantage 
Output Problems:
  • The country/individual that can produce the most has the absolute advantage. The country/individual has lowest opportunity cost has comparative advantage
  • Deals with production
Comparative:
  • Input- is/not
  • Output- not/is
Absolute:
  • Input- Less
  • Output- More


Monday, April 6, 2015

Unit 6 Notes

Notes (4/6/15)

Economic Growth Defined:
  • Sustained increase in Real GDP over time
  • Sustained increase in  Real GDP per capita over time
Why Grow?
  • Growth leads to greater prosperity for society
  • Lessens burden of scarcity 
  • Increase general level of well being
Conditions for Growth:
  • Rule of Law
  • Sound legal and economic institutions
  • Economic freedom 
  • Respect private property 
  • Political and economic stability (low inflationary expectations)
  • Willingness to sacrifice current consumption in order to grow
  • Saving 
  • Trade
Physical Growth:
  • Tools; machinery, factories, infrastructure 
  • Physical capital is product of investment 
  • Investment = sensitive to interest rates and expected rates of return 
  • Takes capital to make capital 
  • Capital must be maintained 
Technology and Productivity:
  • Research and development, innovation and invention yield increase in available technology
  • More technology on hands = increase productivity 
  • Productivity is output per worker
  • More productivity = more economic growth 
Human Capital:
  • People are counting most important resource, therefore human capital must be developed 
  • Education
  • Economic freedom 
  • Right to acquire private property
  • Incentive
  • Clean water 
  • Stable food supply
  • Access to technology 
Economic Growth Illustrated: 

Hindrances to Growth:
  • Economic and political instability (high inflationary expectations) 
  • Absence of the rule of law
  • Diminished Private Property Rights 
  • Negative Incentives (the welfare state) 
  • Lack of savings 
  • Excess current consumption 
  • Failure to maintain existing capital 
  • Crowding Out of Investment (Government deficits and debt increasing long term interest rates)
  • Increase income inequality = populist policies 
  • Restrictions on Free International Trade 


Unit 5 Notes

Notes (4/1/15)

SRAS:  Time to shorten wages to adjust to price level 
  • Workers may not be aware of changes in real wages due to inflation and have adjusted their supply decisions and wages accordingly 
Nominal Wages: Amount of money received per day, per hour, per year 

Real Wages: Adjusted foreign inflation

Sticky Wages: Nominal wage level is set accordingly to initial price level and does not vary (Ex. Stamps) 


Range 1 & 2- Wages are sticky

LRAS: Time long enough for wages to adjust to price level


Notes (4/2/15)

Philips Curve:
  • Represents the relationship b/t unemployment and inflation
  • Trade off b/t inflation and unemployment only occur in short run

Long-Run:
  • Occurs at natural rate of unemployment (4-5%)
  • Represented by vertical line 
  • No trade off b/t unemployment and inflation in long run (economy produces at FE)

LRPC (Long-Run Philips Curve)
  • Will only shift if LRAS curve shifts, otherwise stable
  • 3 Types of Unemployment: change in natural rate of unemployment- seasonal, frictional, structural
  • LRPC assumption is that more worker benefits create higher natural rates and fewer worker benefits create lower natural rates
  • No tradeoff b/t unemployment and inflation
SRPC (Short-Run Philips Curve)
  • An inverse relationship b/t inflation and unemployment (when inflation increases; unemployment decreases)  
  • Have relevance to Okun's Law
  • Since wages are sticky, inflation changes; moves the points on SRPC
  • If inflation persist and expected rate of inflation rise, then entire SRPC moves up, which causes Shock Inflation
  • If inflation expectation drop due to new technology or economic growth, then SRPC moves down 
  • AS shock can cause both higher rate of inflation and higher rates of unemployment 
  • Supply shocks are rapid and significant increases in resource cost
Missery Index: Combination of unemployment and inflation in any given year (single digit misery is good) 2-3% if inflation is 10%; unemployment is 4-5%; if inflation is over heated, so is unemployment) 

Notes (4/6/15)

Long-Run Philips Curve:
  • b/c LRPC exist at natural rate of unemployment (Un) structural changes in economy that affect Un, which would also cause LRPC to shift 
  • Increase in Un shift LRPc right
  • Decrease in Un shift LRPC left
  • Change in technology, economic growth = LRPC to shift 

Stagflation: High inflation & Un at the same time (Ex. Women's Movement) Could go into recession 

Disinflation: Reduction in inflation rate from year to year (Nominal Interest Rate- unadjusted rates) 

Deflation: Relation in which there is an actual drop in price level (opposite of inflation) 

Notes (4/7/15)


Supply Side Economics:
  • It is the belief that the AS curve will determine levels of inflation, Un, and economic growth. 
  • To increase the economy, the AS curve shifts right, which will always benefit the company first. 
  • Focus on Marginal Tax Rates- amount payed on last dollar earned or on each additional dollar earned. 
  • By reducing the marginal tax rate, supply siders believe that you will encourage people to work longer and forego leisure for extra income. 
  • They support policies that promote GDP growth by arguing high marginal tax rate along with current system of transfer payments they provide disincentives to work, invest, and undertake entrepreneurial ventures. 
Raegan Nomies: Lowered marginal tax rate to get out of recession, going into deficit.

  • More government regulation = deficit
  • Less government regulation = surplus 
Laffer Curve: Tradeoff between tax rates and government revenue.
  • Used to support supple side argument 
3 Criticisms of Laffer Curve:
  1. Research suggest impact of tax rates on incentives to work, save, and invest are small
  2. Tax cuts increase demand, which can fuel inflation and causes demand to exceed supply 
  3. The economy is actually located on curve is difficult to determine 

Sunday, March 29, 2015

Unit 4 Video Responses

 Part 1- Money Market Basic Concepts 

Unit 4 part 1 went over the three types of money and also the three functions of money. The three types of money are commodity money, (goods that have other purposes and can be used as money) representative money, (whatever you're using as currency it represents quantity of silver) and fiat money. (money that is worth value because government says so.) Fiat money is the type of money we use today. The three functions of money are medium of exchange, (money that is exchanged for something else) store of value, (expect money to be stable when you save it) and unit of account. (looking at the price and implying its worth) 


Part 3- Money Market Graphs

Unit 4 part 2 talked about the basics of money market graphs and how to manipulate them. This specific graph in the video is very similar to Unit 1 graph, so if demand of money increases it shifts to the right and vise versa. When the interest rate is high on the graph, the quantity demanded is low. When the interest rate is low, the quantity demanded is high. 


Part 4- The Fed: Tools of Money Policy

Unit 4 part 4 discussed how Expansionary policy and Contractionary policy effect the money supply. When the Fed wants to "expand" the money supply, they would decrease their required reserves, lower the discount rate, and buy bonds. If the Fed wants to "contract" the money supply, they would increase their required reserves, increase the discount rate, and sell bonds. Buying bonds gives more money to the public and selling bonds gives more money to the Fed. 


Part 7- Loanable Funds Graph

Unit 4 part 7 went over on how to use the Loanable Funds Graph. It has similar qualities with the Money Market Graph, except the demand slope is labeled as "Demand Loanable Funds" and the supply line is slopping upward. If the government is on a deficit, it would shift the demand slope to the right because the government is demanding more money, which would also increase the demand for loanable funds. You can draw the Money Market Graph and Loanable Funds Graph side by side in order to double check if you're manipulating the graph correctly. 


Part 8- Money Creation Process

Unit 4 part 8 went in depth of how the money creation process works. They used an example of a loan of five hundred dollars, a reserve requirement of twenty percent and a question of what would be the total amount of money created from this loan. You would take the money multiplier equation (1 over required reserve) and multiply that result by five hundred; giving you the total amount of twenty-five hundred dollars. This amount is not always guaranteed; it is only guaranteed in the circumstances of the bank holding no excess reserves. 


Part 9- Relating Money Market, Loanable Funds Market, and AD-AS

Unit 4 part 9 explains how to tie in the Money Market, Loanable Funds Market, and AD-AS graph to the AP exam. The problem example they used is government deficit. When the government is in deficit, it increases the demand of money in Money Market and Loanable Funds Market; also increasing aggregate demand in the AD-AS graph. It is recommended to show an increase in demand on the Loanable Funds Market because it shows a consistent increase in interest rate.


Tuesday, March 24, 2015

Unit 4 Notes

Money (3/3/15)

Money: Any asset that can be used to purchase goods and services. 

3 Uses of Money:
  1. As median of exchange- used to determine value (how much it is worth)
  2. Unit of Account: Used to compare prices 
  3. Store of Value- Some people choose to lend money or bank (bank draws interest) makes difference 
3 Types of Money:
  1. Commodity Money: Has value within itself (Ex. salt, olive oil, gold) 
  2. Representative Money: Represent something of value (Ex. IOU)
  3. Fiat: Money because government says so (not all money is currency)
6 Characteristics of Money:
  1. Durability:  How long it lasts 
  2. Portability: Can take it to places 
  3. Visibility:  Can be broken down
  4. Uniformity: Money is same
  5. Limited Supply:
  6. Acceptability: People will take it 
Money Supply: Total value of financial assists available in U.S economy

M1 Money:
  • Involves liquid assets (easily to convert to cash)
  1. Coins
  2. Currency (paper)
  3. Check Deposits/ Demand Deposits
  4. Travelers Check 
M2 Money:
  • M1 Money + Savings Account + Money Market Account 

3 Purposes of Financial Institutions: 
  1. Store money
  2. Save money
  3. Loan money:  Reasons- Credit Cards & Mortgages 
4 Ways to Save:
  1. Through savings account
  2. Checking account
  3. Through Money Market Account
  4. Through Certificate of Deposit (CD)
  • Highest Interest Rate: Money Market Account & Certificate of Deposit (CD) 
Loans:
  • Banks operate on fractional reserve system; they help a fraction of the funds & loan out the rest. 
Interest Rates:
  • Principal: Amount of money borrowed 
  • Interest: Price payed for the use of borrowed money
  • Simple Interest: Paid on the principle
  • Compound Interest: Paid on the principal plus accumulated interest 
Simple Interest:
  • I = P x R x T/ 100 
  • P- Principal; R- Interest Rate; T- Time
  • Time (T) = I x 100/ P x R
  • R = I x 100/ P x T
  • P = I x 100/ R x T 
Types of Financial Institutions: 
  1. Commercial Bank
  2. Savings & Loan Institutions 
  3. Mutual Savings Banks
  4. Credit Union 
  5. Financial Companies 
Investment: Redirecting resources; consume for the future 

Financial Assets: Claims on property and income of borrower (income of property) 

Yield: Annual rate of return on a bond if bond held to maturity 

Financial Intermediaries: Institution that annual funds from savers to borrowers 
  • 3 Purposes:
  1. To share risk: Through diversification- spreading out investments to reduce risk 
  2. To provide information: Be advised 
  3. Liquidity:
  • Returns- Money an investor reduces above and beyond the sum of money that was initially invested (higher risk = higher return) 
Bonds: Loans/ IOU that represent debt that the government/corporation must repay to an investor

3 Components of a Bond:
  1. Coupon Rate: Interest rate that a bind issuer will pay to bond holder 
  2. Maturity: Time at which payment to bond holder is due 
  3. Par Value: The principal- the amount an investor pays to purchase a bond

Time Value of Money (3/4/15)

Is dollar today worth more than a dollar tomorrow? 
  • Yes 
Why?
  • Opportunity cost and inflation. This is the reason for charging and paying interest 
Formulas:
  • V: Future value of $
  • P: Present value of $
  • r: Real interest rate (nominal rate - inflation rate) expressed as decimal
  • n: years
  • k: number of times interest is creditable per year 
Simple Interest Formula: V = (1 + r) ^n x P 

Compound Interest Formula:  V = (1 + r/k) ^nxk x P


Monetary Equation of Exchange: 
MV = PQ
  • M: Money supply (M1 or M2)
  • V: Money's velocity (M1 or M2)
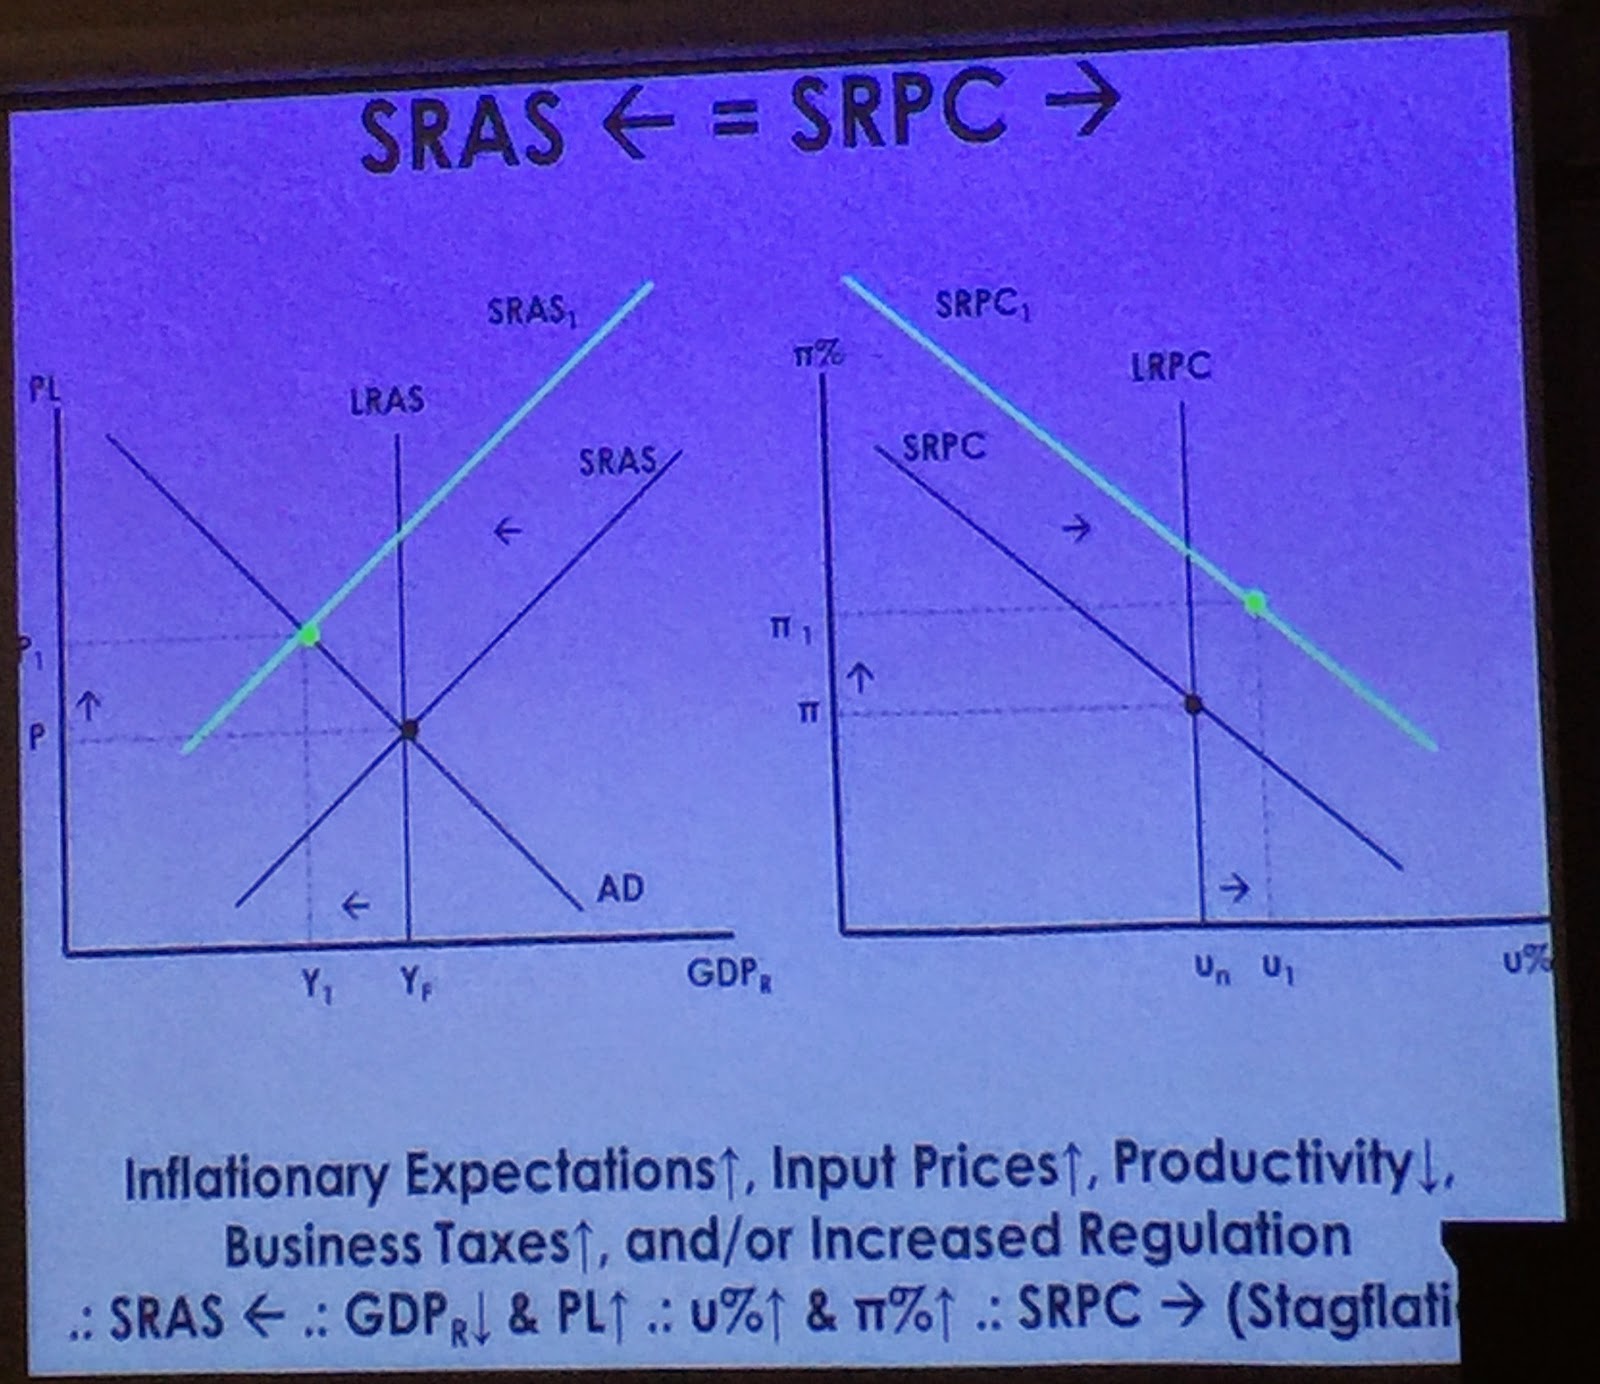
  • P: Price level (PL on AS/AD diagram)
  • Q: Real GDP (sometimes labeled "Y" on the AS/AD diagram) 
Functions of FED:
  • issues paper currency 
  • sets reserve requirements and holds reserve of banks 
  • lends money to banks and charges them interest 
  • it acta as personal bank for government 
  • supervises member banks 
  • control money supply in the economy 

How do banks "create" money?
  • By lending out deposits that are used multiple times 
Where do the loans come from? 
  • From depositors who take cash and place it in their banks 
How are the amounts of potential loans calculated?
  • Using their bank balance sheet or T-accounts that consist or assets and liabilities for banks 

Bank Liabilities (the right side of the T Account Sheet) (OWE)

1) Demand Deposits (DD) or Checkable Deposits 
  • Cash deposits front eh public 
  • They are liabilities because they belong to depositors 
2) Owners Equity (stock shares)
  • There are values of stocks held by the public ownership of bank shares 

Key concept for AP concerning Liabilities: 
  • If demand deposit come from someone's cash holdings, then the DD is already part of money supply 
  • If DD comes in from purchase of bonds (by FED) then this creates new cash and therefore creates new money supply (M1)
Assets (OWN)
  • RR
  • ER
  • Property
  • Securities 
  • Loans 
Liabilities (OWE) 
  • DD
  • Owners Equity

Bank Assets (the left side of the T Account Sheet):

1) Required Reserves (RR)
  • These are the percentages of DD that must be held in vault so that some depositors have access to their money. This amount can carry, but AP usually uses 5%, 10%, or 20% for easy calculations. 
2) Excess Reserves (ER) 
  • These are the source of new loans. These amounts are applied to Monetary Multiplier/ Reserve Multiplier (DD = RR + ER) 
3) Bank Property Holdings (buildings & fixtures)

4) Securities (Federal Bonds)
  • These are bonds purchased by the bank or new bonds sold to the bank by the Federal Reserve. These bonds can be purchased from the bank, turned into cash, that immediately becomes available as "Excess Reserves"
5) Custom Loans 
  • This can be amounts held by banks from previous transactions, owned to the bank by prior customers.
Money Creation (Using Excess Reserves) 
  • Banks wants to create profit. Generate profit by lending the excess reserves and collecting interest. Since each loan will go out into customers and business accounts, more lans are created in decreasing amounts (because of RR) Rough estimate of # of loan amounts created by any first loan is the "money multiplier" 
The Monetary Multiplier (also known as):
  • Checkable Deposit Multiplier 
  • Reserve Multiplier 
  • Loan Multiplier 
The formula is simple: 1 divided by the RR:
  • RR = 10% = 1/.1 = Munetary Multiplier of 10
Excess Reserves are multiplied by the Multiplier- to create new loans for the entire baking system and this creates new money supply.


3 Types of Multiple Deposit Expansion Questions (3/5/15)

  • Type 1: Calculate initial change in excess reserves. AKA the amount a single bank can loan from the initial deposit. 
  • Type 2: Calculate change in loans in balancing system 
  • Type 3: Calculate change in money supply. Sometimes type 2 and type 3 will have the same result. (ex. no Fed involvement) 
  • Type 4: Calculate the change in DD 


Creating a Bank (3/6/15)

Vault Cash = Cash held by bank 

Reserve Ratio: Commerical Bank's RR/ Comercial Bank's CD Liabilities 

Excess Reserves: Actual Reserves - RR

RR:  CD x Reserve Ratio

ASSETS:
  • Required Reserves (RR): % required by Fed to keep met demand 
  • Excess Reserves (ER): % reserves over and above amount reduced to satisfy minimum reserve  ratio by Fe 
  • RR + ER = DD
  • Loans to firms, consumers, and other banks (earns interest)
  • Loans to government: Treasury Securities 
  • Bank Property:If bank funds, you could liquidate the building/property. 

LIABILITIES + EQUITY:
  • Demand Deposits: $ put into bank
  • Timed Deposits: CD's
  • Loans from: Federal Reserves and other banks 
  • Shareholders equity: to set up bank, you must invest your own money in it to have a stable in banks success or failure 
Bank Balance Sheet = Assets & Liabilities in a TALL COUNT

Liablities = 
  • DD (Demand Deposits/ Checkable Deposit, Check)
  • Owner's Equity (stock shares) 
Assets =
  • RR
  • ER
  • Bank Property
  • Securities 
  • Loans 
Assets must Equal Liabilities: DD = RR + ER

The Money Supply is affected

  • Cash from a citizen becomes DD, but does NOT change money supply; the ER from this cash becomes an "immediate loan amount"

  • ER x Multiplier become new loans and DD changes money supply 

  • The Fed buying bonds create new loans and change  money supply 

  • IF the Fed buys the bonds on open market, this also becomes a new DD amount
  • IF the Fed buys bonds from accounts already held by particular bank, then the amount only belongs to new ER

Notes (3/17/15)

Key Principles:
  • Single bank can create money (through loans) by the amount of excess reserves 
  • Banking system as a whole create money by a multiple (deposit or money multiplier) of initial excess reserves 

INITIAL DEPOSIT      NEW/EXISTING $       BANK RESERVES      IMMEDIATE CHANGE MS

   CASH                            EXISTING                      INCREASE             NO; COMPOSITION OF M1 
                                                                                                                   MONEY CHANGES (CASH 
                                                                                                                   TO CURRENCY)


   FED PURCHASE
  OF BOND FROM 
  PUBLIC                          NEW                               INCREASE             YES; MONEY COMING 
                                                                                                                    FROM FED PUTS NEW $
                                                                                                                    IN CIRCULATION


BANK PURCHASE 
BOND FROM PUBLIC      NEW                              INCREASE             YES; B/C MONEY IS 
                                                                                                                     COMING FROM 
                                                                                                                     RESERVE WHICH PUTS
                                                                                                                     NEW $ IN CIRCULATION


Cash: Money created in banking system only 

Factors that weaken the effectiveness of Deposit Multiplier:
  1. If banks fail to loan out all ER
  2. If bank customers take this loans in cash rather than in new checking account deposits, it creates a cash or currency drawn 

Money Market (3/17/15)

Demand for money has an inverse relationship between nominal interest rates and quantity of money demanded. 
  • MD & DM increase; ir decreases
  • MD & DM decrease; ir increases 
MD: Money Demand 
DM: Demanded Money 

  • If AD increases, they are buying bonds 
  • If AD decreases; they are selling bonds
Money Market Graph, Loanable Funds Market Graph, and AD-AS Graph Comparison:


Notes (3/19/15)

Fiscal:
  • Congress: The President 
  • Tax on spend
Monetary:
  • The Fed (Federal Reserve Bank)
  • Benefit: FID assured
  • OMO: Open Market Operation
  • Discount Rate
  • Federal Fund Rate
  • Reserve Requirement 

                                  EXPANSIONARY                                          CONTRACTIONARY
                                   "EASY MONEY"                                              "TIGHT MONEY"

O.M.O                   BUY BONDS; INCREASE                                    SELL BONDS; DECREASE
                              MS                                                                           MS


DISCOUNT          DECREASE                                                            INCREASE
RATE


RESERVE
REQUIREMENT       DECREASE                                                       INCREASE


Recession: Money should be circulating (RR)

Required Reserves: Amount of money bank has to keep for its reserves 

Discount Rate: Interest rate that the Fed charge commercial banks for borrowing money 

DR: Recession- Lower interest rate, more money to get

Federal Fund Rate: Where FDIC member banks loan each other over night funds in order to balance account each day (simply interest rate banks charge each other for borrowing money)

Prime Rate: An interest rate bank charge to their most credit worthy customers (if you have 0-4%, your credit is good; higher than 4 = bad credit score) 


Notes (3/23/15)

Loanable Funds Market: Market where savers and borrowers exchange funds (QLF) at real rate of interest (r%)

The demand for loan bale funds/borrowing loans from households, firms, government and foreign sector. Supply of loanable funds is also the demand for bonds. 

Loanable Funds Market in Equilibrium 

Changes in Demand for Loanable Funds:
  • Demand for loanable funds = borrowing (supplying bonds)
  • More borrowing = more demand for loanable funds (shifts right)
  • Less borrowing = less demand for loanable funds (shifts left)
Examples:
  • Government deficit spending = more borrowing = more demand for loanable funds; DLF shifts left; r% increases 
  • Less investment demand = less borrowing = less demand for loanable funds; DLF shifts left; r% decrease 
Change in Supply of Loanable Funds:
  • Supply of loanable funds = saving (demand for loans) 
  • More saving = more supply of loanable funds (shifts right)
  • Less saving = less supply of loanable funds (shifts left) 
Examples:
  • Government budget surplus = more saving = more supply of loanable funds; SLF shifts right; r% decreases
  • Decrease in consumers' MPS = less saving = less supply of loanable funds; SLF shifts left; r% increases
When government does fiscal policy it will affect the loanable funds market 
Changes in real interest rate (r%) will affect Gross Private Investment 


Thursday, February 26, 2015

Unit 3 Notes

Aggregate Demand (2/11/15)

AD: Shows amount of real GDP that the private, public, and foreign decor collectively desire to purchase at each possible price level. 
  • Relationships between the price level and the level of real GDP is inverse


3 Reasons AD is Downward Slopping:


  • Real Balances Effect: 
-When the price level is high; households and businesses can not afford to purchase as much output
-When price level low, households and businesses can afford to purchase more output


  • Interest Rate Effect: 
-Higher price level increases interest rate which tends to discourage investment
-Lower price level decreases the interest rate which tends to encourage investment


  • Foreign Purchases Effect:
-Higher price level increases the demand for relatively cheaper imports
-Lower price level increases foreign demand for relatively cheaper exports

Shifts in AD:
*There are 2 parts to shifts in AD

  • A change in C, Ig, G, and/or Xn
  • Multiplier effect that produces a greater change than original change in 4 components 
Increases in AD = Shifts right
Decreases in AD = Shifts left 

Increases in AD


Decreases in AD 


Consumption:
-Consumer wealth
More wealth = more spending (AD shifts right)
Less wealth = less spending (AD shifts left) 

-Consumer Expectations 
Positive expectations = more spending (AD shifts right)
Negative expectations = less spending (AD shifts left) 

-Household indebtedness 
Less debt = more spending (AD shifts right)
More debt = less spending (AD shifts left)

-Taxes
Less taxes = more spending (AD shifts right)
More taxes = less spending (AD shifts left) 

Gross Private Investment:

  • Investment spending is sensitive to:
The Real Interest Rate:
Lower interest rate = more investment (AD shifts right) 
Higher interest rate = less investment (AD shifts left) 

-Expected Returns 
Higher expected returns = more investment (AD shifts right) 
Lower expected returns = less investment (AD shifts left) 

-Expected Returns are influenced by:

  • Expectations for future profitability 
  • Technology 
  • Degree of excess capacity (existing stock of capital) 
Government Spending:
More government spending (AD shifts right)
Less government spending (AD shifts left) 

Net Exports:
  • Net exports are sensitive to:
-Exchange Rates (international value of $)
Strong $ = more imports and fewer exports (AD shifts left)
Weak $ = fewer imports and more exports (AD shifts right)

Relative Income:
Strong foreign economies = more exports (AD shifts right)
Weak foreign economies = less exports (AD shits left)


Aggregate Supply (2/12/15)

Long Run: Period of time where input prices are flexible and adjustable to changes in price level.

  • Level of RGDP supplied is independent of price level 
Short Run: Period of time where input prices are sticky and do not adjust to change in price level

  • Level of RGDP supplied directly related to price level 
RGDP = output 

Long- Run AS (LRAS):
-LRAS makes level of full employment in economy (analogues to PPC)
-Because input prices completely flexible in long-run, changes in price level do not change firms real profits and do not change firms level of output. This means LRAS is vertical at economy's level of full employment.

LRAS Graph


Short-Run AS (SRAS)
-Because input prices are sticky in short run, the SRAS is upward sloping

SRAS Graph


Changes in SRAS

  • increase in SRAS = shifts right 
  • decrease in SRAS = shifts left 
  • key to understanding shifts in SRAS is per unit cost of production 
Per-Unit Production Cost: Total input cost / total output

Increase in AS 


Decrease in AS 


Determinants of SRAS (all affect unit production cost)

Input Prices:

  • Domestic Resource Prices 
  • Wages (75% all business costs)
  • Cost of capital 
  • Raw material (commodity prices)
Foreign Resource Prices:
Strong $ = lower foreign resource prices 
Weak $ = higher foreign resource prices 

Market Power:

  • Monopolies and cartels (Ex. OPEC dollars for oil) control resources, control prices of resources 
Increase in resource prices = SRAS shifts left 
Decrease in resource prices = SRAS shifts right 

Productivity:

  • P = total output / total inputs 
  • More production = lower unit production costs (SRAS shifts right) 
  • Lower production - high unit production cost (SRAS shifts left) 
Legal Institution Environment
Taxes & Subsidies 

  • Taxes ($ to gov.) to business increase per unit production cost = SRAS shifts left 
  • Subsidies ($ from gov.) to business reduce per unit production cost = SRAS shifts right 
Government Regulation:

  • Governemnt regulation creates cost of compliance = SRAS shifts left 
  • Deregulation reduces cost of compliance = SRAS shifts right 

Notes (2/17/15)

Full Employment: Full employment equilibrium exists where AD intersects SRAS & LRAS at same point 

Recessionary Gap: Exists when equilibrium occurs below FE output 

Inflationary Gap: Exists hone equilibrium occurs beyond FE output 

  • u = unemployment 
  • (pie sign) = inflation (Cheat sheet) 
Investment: Money spent or expenditures on:
  • New plants (factories) 
  • Technology (hardware and software)
  • Inventories (goods sold by producers) 
  • Capital equipment (machinery)
  • New homes 

Expected Rates of Return:

How business make investment decisions? 
  • Cost/ benefit analysis

How does business determine benefits?

  • Expected rate of return 
How does business count the cost?
  • Interest costs

How does business determine the amount of investment they undertake?

  • compare expected rate of return to interest cost 
  • if expected return > interest cost, then invest
  • if expected return < interest cost, then do not invest 
Real (r%) v. Nominal (i%)
Difference?
  • Nominal is observable rate of interest, real subtracts out inflation and only know export factor 
How to compute relate interest rate (r%) ?
  • r% = i% - (pie symbol)%
What determines cost of investment decision?
  • Real interest rate (r%)
Investment Demand Curve
What is the shape of Investment Demand Curve?
  • Downward slopping 
Why?
  • When interest rates are higher, fewer investments are profitable
  • When interest rates are lower, more investments are profitable 

Shifts in Investment Demand (2/18/15) 

Cost of Production:
lower costs shift ID right 
higher costs shift ID left 

Business Taxes :
lower business taxes shifts ID right 
higher business taxes shifts ID left 

Technological Change: 
new tech. shifts ID right
lack tech. shifts ID left 

Stock of Capital: 
if economy low on capital = ID shifts right 
if economy high on capital = ID shifts left 

Expectations: 
Positive = ID shifts right 
Negative = ID shifts left 

  • LRAS represents point on economy production possibility curve. The LRAS is a vertical line at an output level that represents quantity of goods and services a nation can produce over a sustained period using all of its productive resources. 
  • LRAS is always at full employment. Does not change as price level changes, shifts outward if change in technology, resource, or economic growth 

The School of Economics (2/19/15)

Classical:

  • Adam Smith
  • John B. Say
  • David Ricardo
  • Alfred Marshal
  • Says competition is good 
  • Invisible Hand: means market runs itself 
  • Concept laissez faire (no gov. intervention)
  • Say's Law: Supply creates own demand (w/e output is produced, that is what's going to be demanded)
  • Economy is always to/at FE
  • Trickle Down Effect: Help rich first, then help everyone else 
  • Savings (Leakage)
  • Investment (Injection)
  • Savings increase with interest rate (higher IR- save; low IR- spend)
  • prices in wages are flexible downward (higher minimum wage could cut hours) 
  • AS determines output 
  • AS=AD at FE

Keynesian:

  • John Maynard Keynes 
  • Congress 
  • Competition is flawed 
  • AD is key, not AS 
  • Demand creates its own supply, AD creates its own output 
  • Savers/savings does not equal investment 
  • Savings are inverse to interest rate 
  • Leaks causes constant recession 
  • Savings also causes recession (suppose to spend) 
  • Ratchet Effects & Sticky Wages: Block Say's law
  • Since no mechanism guarantee at FE, in long run we are dead 
  • The economy is not always close/to at FE 
  • Use fiscal policy 
  • Add stabilizer 
  • Use expansionary/contractionary polices 

Montary:

  • Alan Greenspan
  • Ben Barnanke 
  • Congress can't time policy options 
  • Voters won't allow contractionary options 
  • Easy Money, Tight Money
  • We can change the required reserves if needed 
  • We can buy/sell bonds through open market operation 
  • We can use interest rate to change the federal fund and discount rate 

Notes (2/20/15)

Disposable Income:

  • income after faces or net income 
  • DI = gross income x races 
  • 2 choices 
  1. Concome (spend money on goods and services)
  2. Save (not spend on goods and services)
Consumption:

  • Household spending 
  • Ability to consume is constrained by: 
  1. amount of disposable income 
  2. propensity to save 
  3. DI household consume if DI = O
  4. autonomous consumption 
  5. dissaving 
  6. APC = C/DI = %DI that is spent 
Saving: 

  • household NOT spending 
  • ability to save is constrained by: 
  1. amount of disposable income 
  2. propensity to consume 
  3. do household save if DI = O 
  4. APS = S/DI = % that is not spent 
APC & APS:

  • APC + APS = 1
  • 1 - APC = APS 
  • 1 - APS = APC 
  • APC > 1: Dissaving 
  • APS is dissaving 
MPC & MPS:

  • marginal propensity to consume 
  • Change C / Change DI 
  • % of every extra dollar earned that is spent 
  • marginal propensity to save 
  • Changes S / Changes DI 
  • % of every extra dollar earned that is saved 
  • MPC + MPS = 1 
  • 1 - MPC = MPS 
  • 1 - MPS = MPC 
Spending Multiplier Effect:

  • initial change in spending ( C, G, XN) causes a larger change in AS or AD 
  • Multiplier = change in AD / change in spending 
  • why does this happen?
  • Expenditure  & income flow continuously which sets off a spending increase in the economy 
Calculating Spending Multiplier: 

  • Multiplier = 1 / 1 - MPC or 1 / MPS 
  • multiplier are (+) when there is an increase in spending & (-) negative when there is a decrease 
Calculating the Tax Multiplier: 

  • When fix taxes the multiplier works in reverse because now money os leaving the circular flow
  • Tax Multiplier = -MPC / 1 - MPC or -MPC/MPS
  • if there is a tax cut the multiplier (+) because now more money in circular flow 

Fiscal Policy (2/25/15)

Fiscal Policy: changes in the expenditures or taxes revenues of the federal government 

2 Tools:
  • Tax:  Government can increase/ decrease taxes
  • Spend: Government can increase/ decrease 
  • controlled by CONGRESS not by president 
Balanced Budget: Revenues = expenditures 

Budget Deficit: Revenues < expenditures 

Budget Surplus: Revenues > expenditures 

Government Deficit:
  • Sum of all deficits - sum of all surpluses 
  • government must borrow money when if deficit
Government borrows money from: 
  1. Individuals 
  2. Corporations 
  3. Financial Institutions 
  4. Foreign entities or foreign governments (through process of land) 
Fiscal Policy (2 options)
  • Discretionary: (Action)
  • Expansionary Fiscal Policy: Think deficit
  • Contractionary Fiscal Policy: Think surplus
  • Non-Discresionary Fiscal Policy: (No action)
Discretionary v. Automatic Fiscal Policies: 
  • Discretionary: increasing/ decreasing government spending or taxes in order to return the economy to FE. Policy involved policy makers doing fiscal policy in response to economic problem 
  • Automatic: unemployed compensation and marginal tax rates are example of automatic policies that help mitigate the effect of recession and inflation. It takes place without policy makers having to respond to current economic problems. 
Contractionary v. Expansionary Fiscal Policy:


  • Contractionary: policy designed to decrease AD. Strategy for controlling inflation (decrease in spending & increase taxes)


  • Expansionary: policy designed to increase AD. Strategy for increasing GDP, reduces unemployment & combatting recession. (increases government spending & decreases taxes) 


Automatic or built in stabilizer: 
  • without requiring exilic action by policy makers 
Non-Discretionary Fiscal Policy: 
  • corporate dividends
  •  social security 
  • veteran's benefits 
Progressive tax system: Average tax rate (tax revenue / GDP) rises with GDP

Proportional tax system: Average tax rate remains constant as GDP changes 

Regressive tax system: Average tax rate falls with GDP

Saturday, January 31, 2015

Unit 2 Notes

Circular Flow Chart 

Circular Flow Chart 


GDP: Gross Domestic Product; total dollar value of all final goods & services produced within a country's borders within a given year. (ONLY compass what is produced in AMERICA; can DECREASE when not spending money) 

GNP: Gross National Product; it measures of what its citizens produced and whether they produce these items within its borders. 

National Income Accounting: Economist collets statistic on production, income, investment, and savings. 

Number 1 sign of checking GDP- Gas money; transportation. 

Formula to GDP- C+Ig+G+Xn

What's included in GDP?
  • C- Consumption; takes 67% of economy's final goods and services; even part of wages.
  • Ig- Gross Private Domestic Investment; factory equipment maintenance, new factory equipment, construction of housing, unsold inventory of products built in a year. 
  • G- Government Spending; government buying military weapons, buying school/ bus.
  • Xn- Net Exports; Exports-Imports
What's  NOT included in GDP?
  • Used/second hand goods (Hand me downs)
  • Intermediate Goods: Goods & services that are purchased for resale or for further processing/ manufacturing (NOT COUNTED; BUYING WHOLE CAKE NOT LAYERS)
  • Non-Market Activities: Volunteer work. (Ex. baby sit, illegal drug sales, underground activities) 
  • Financial Transactions: Stocks, bonds, real-estate 
  • Gifts/Transfer Payments:
Public- recipients contribute nothing to cut tent production. (Ex. Social security, welfare payments)
Private- Produces no output; simply transferring funds from 1 individual to another. (Ex. scholarship, Christmas gift) 

GDP & GNP Formulas (1/28/15)

Budget: Gov. purchases of goods & services + Gov. transfer payments - Gov. tax & fee collections 

Positive- budget deficit
Negative- budget surplus

Trade: Exports - Imports 
GNP: GDP + Net Foreign Factor Income (use expenditure approach for GDP)
Net National Product (NNP): GNP - Depreciation 
NDP: GDP - Depreciation 
National Income: GDP - Indirect Business Taxes - Depreciation - Net Foreign Factor Payment
OR
                            Compensation of Employees + Rental Income + Interest Income + Proprioriters               Income + Corperate Profits

Disposal Personal Income: National Income - Personal Household Taxes + Gov. Transfer Payments

Expenditures Approach: Adding up market value of all domestic expenditures made on all final goods & services in a single year.
C + Ig + G + Xn (Exports-Imports) = GDP

Income Approach (WHAT YOU REPORT): Adding up all income earned by households and firms in a single year.
GDP= W + R + I + P + Statistical Adjustments

  • Wages: Compensation of employees; salary.
  • Rents: From tenants to land lords; lease payments that corporations pay for use of space.
  • Interest: Money payed by private businesses to suppliers of loans, used to purchase capital.
  • Profit:
  1. Corporate income taxes.
  2. Dividends 
  3. Undistributed corporate profits. (Ex. dividens, depreciation, wages & salaries, corporate income tac, undistributed rotate profits, net foreign factor income earned)

Nominal GDP v. Real GDP (1/29/15)

Nominal GDP: Value of output produced in current prices; can increase from year to year of either output are price increase.

Real GDP: Value of output produced in base year or constant prices; adjusted for inflation; can increase from year to year only if output increases. (Base year/ earlier year) 

Nominal GDP & Real GDP Formula- P X Q

Calculating Nominal & Real GDP Ex:

                   Yr.1 Q          Yr.4 P          Yr.1 P          Yr.4 Q       
Comp.            10                17              $2000         $2200
T.V                 15                20              $500           $550    

Nominal GDP Steps-
  1. 17 x $2200 = $37400
  2. 20 x $550 = $1100
  3. $37400 + $1100 = $48400
Real GDP Steps-
  1. 17 x $2000 = $34000
  2. 20 x $500 = $10000
  3. $34000 + $10000 = $44000
Price Index: A measure of inflation by tracking changes in market basket of goods compared with the base year. 
  • Formula for Price Index- Price Market Basket of goods in current year/ Price Market Basket of goods in base year x 100
GDP Deflector: Price index used to adjust from Nominal GDP to Real GDP
-In base year, GDP deflector is equal to 100
-For years after base year, GDP deflector is greater than 100
-Years before base year, GDP deflector is less than 100
  • Formula for GDP Deflector- Nominal GDP/ Real GDP x 100
Inflation Formula- New GDP Deflector - Old GDP Deflector/ Old GDP Deflector x 100


Inflation (2/2/15)

Inflation: A rise in general level of prices. 
  • Standard inflation 2-3%
Inflation Rate: It measure the percentage increase in price level over time; offers key indicator pf economy's health. 

Deflation: Decline in general price level.

Disinflation: Occurs when inflation rate declines.

Consumption Price Index (CPI): Measures inflation by tracking yearly price of fixed basket of consumer goods & services;indices changes in price level and cost of living.


  • Solving inflation problems: 

A) Finding inflation rate using basket market.
-Curent year market basket - Base year market basket value / Base year market basket value x 100

B) Finding inflation rate using price indexes 
-Curent year price index - Base year index / Base year price index x 100

C) Estimating Inflation
-Rule of 10 used to calculate number of years it would take for price level to double at any given rate of inflation.

  • Ex. Years needed to double inflation = 70 (Annual rate is 5%); Years needed to double 14
D) Determining real wages. 
-Real wages = Nominal Wages / Price Level x 100

E) Finding Real Interest Rate
-Real interest rate - Nominal interest rate - inflation premium will give you real interest rate.

Real Interest Rate: The cost of borrowing or lending money that is adjusted for inflation; always expressed as percentage.

Nominal Interest Rate: Unadjusted cost of borrowing or lending money,

Rule of 70:    Used to calculate the number of years it will take for the price level to double at any given rate of inflation.

Causes of Inflation

A) Demand Pull Inflation: Caused by an excess of Demand over Output that pulls prices upward. (Ex. Concert; more people, more higher prices, closer seats.)

B) Cost Pull Inflation: Caused by a rise in per uint production cost due to increasing resource cost. (Ex. If gas oil goes up, plane tickets go up.)

Effects of Inflation:
  • Anticipated- Expecting to happen.
  • Unanticipated- Suddenly happening. (Ex. Manager says everybody is fired; sudden)

Hurt by Inflation

  • Fixed Income (Ex. Social Security, scholarship, grants)
  • Savers (Can not change)
  • Lenders/ Creditors (Worth less)

Help by Inflation

  • Borrowers- debt will be repaid with cheaper dollars than those loaned out. 

Unemployment (2/3/15)

Unemployed: Percentage of people who do not have jobs but in labor force.

Labor Force: Number people in country that are classified either employed or unemployed

  • Unemployment Rate Calculation: Number unemployed/ Number unemployed + Number employed x 100
Unemployment Percentage: 4-5%

Not in Labor Force

  1. Kids
  2. Military personnel 
  3. Mentally insane 
  4. Prison
  5. Retired 
  6. Stay at home parents 
  7. Full time students
  8. Discourage workers 

Types of Unemployment

  • Frictional: "Between jobs" People between jobs because they choose new opportunities, choices, life styles, new education levels. 
  • Structural: Technology changing, lack of skills, declining industry (NASA, type writer technician)
  • Seasonal: Waiting right season to go to work. (Ex. Santa Claus, easter bunny, life guards)
  • Cyclical: Occurs due to swing in economy deals with business cycle. (Ex. Trough)
Full Employment: Occurs when no cyclical
-Unemployment is still present but only 4-5%; Economy producing at full potential possible. (Not everybody working)

National Rate of Unemployment (NRU): 4-5%

Why unemployment is bad?

  1. Not enough consumption (GDP) Not working, not buying 
  2. Too much poverty 
  3. Too much government assistance

Why unemployment is good?

  1. Less pressure to raise wages
  2. More workers available for future expansion. 
Okun's Law: For every 1% of unemployment above the NRU causes 2% decline in real GDP (Ex. If unemployment 3.5%, NRU is 7% (3.5 x 2 = 7) )